API Testing
While it's fairly easy to capture the full nature of front-end or client-side (web/app) issues by providing full and accurate descriptions of reproducible functional user behavior and/or providing screenshots, the same cannot be said for systems or API issues. By its very nature, you can never fully isolate back-end/systems behavior when accessing it through a mobile app, website, or whatever the vehicle the end user will use to access it. Luckily, there are many tools and resources that can be utilized to discover exactly what APIs should be sending to and from the apps/websites, making it easier to determine which codebase is causing an issue, and to see exactly what is going wrong.
Vokal Github Readme Files
Before starting to test anything related to the API, it's important to understand exactly how the API is intended to work with the website or app. Details about all API calls, including the headers, what gets sent to the back-end, and what gets returned by the back-end, can be found in either the Readme or API Docs file located in the folder for your project's API at https://github.com/vokal
The document will contain a table of contents, which lists all of the API calls that will be made by the app.
API Details
Method
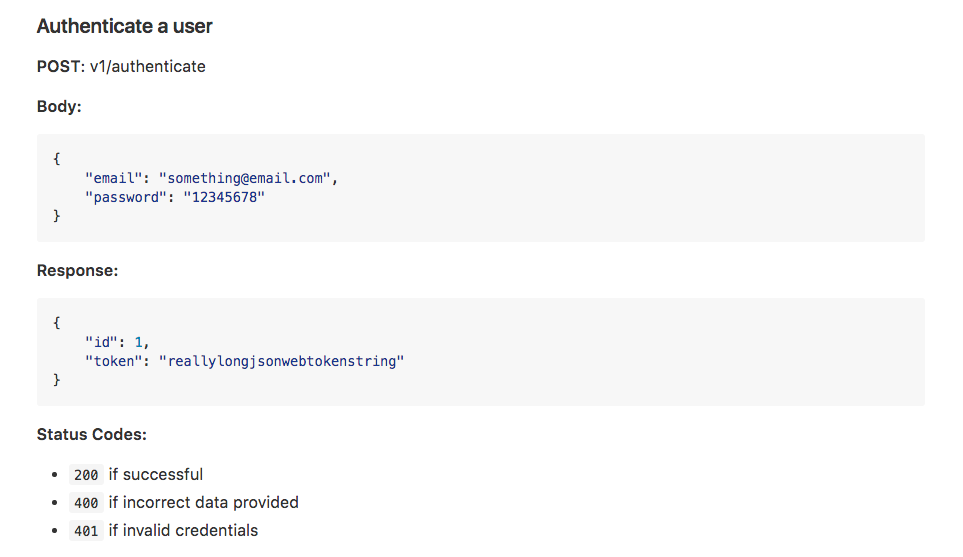
The first piece of information that will be included in the details for any API call is the method of the call.
The method indicates what the call is doing. Common methods include:
- POST - Takes information from the app/website and sends it to the back-end, creating a new item. IE - A brand new user is created, with numerous fields/variables for that user.
- PATCH - Takes information from the app/website and sends updates to specific fields within an item to the back-end. IE - Takes an existing user, and updates one field for that user, like an email address, etc.
- PUT - Takes information from the app/website and sends updates to all fields for an item to the back-end. IE - Takes an existing user, and resends values for all fields.
- GET - Takes information from the back-end and pulls it into the app/website. IE - Viewing another user's profile.
- DELETE - Tells the back-end to remove an item.
Path
Immediately following the method, the path of the function is listed. APIs will typically be located at a location like api.[project name].com, api-staging.[projectname].com, or something along those lines. The path in the document will usually be whatever comes after that slash. No two paths will be the same, though there may be multiple API calls within a single folder for organization/grouping purposes. For example, you may have /login/authenticate and /login/somethingelse.
Additionally, the path may also indicate an API's version number, starting with /v1/, /v2/, /v3/, etc.
Body
The next section of the documentation, labeled Body, shows what the app/website is sending to the back-end. The section will contain fields and values, in the format of "[field]": "value",
Response
Next, the response is listed, which shows what the back-end sends back to the app/website in response to the values that were sent to it. Again, this section contains fields and values in the same format as the body.
Not all API calls will contain both the Body and Response sections. Depending on the call, one of those sections may be skipped. For example, on GET calls, the app/website doesn't send fields/values to the back-end, and merely requests a piece of information, the parameters of which are specified in the API path. For example, when requesting a user's profile information, the app/website could make a GET call to /something/users/[user ID] which contains no body, but does receive a response containing all of the information for that user.
Status Codes
Finally, the documentation will also often list a set of error codes that may be returned if the app/website sends fields/values that the back-end doesn't know how to handle. Reviewing and understanding these error codes is vital when attempting to determine the cause of a defect with an ambiguous source (where it's unclear if the defect is coming from the app/website, or the back-end).
Monitoring API Calls
Armed with an understanding of how the API should facilitate communication between the app/website and the back-end, the next step is to actually monitor API traffic while testing. For websites on desktop browsers, built-in developer tools can accomplish this task. For mobile apps or websites on mobile browsers, a desktop application called Charles provides visibility into this traffic.
Browser Developer Tools
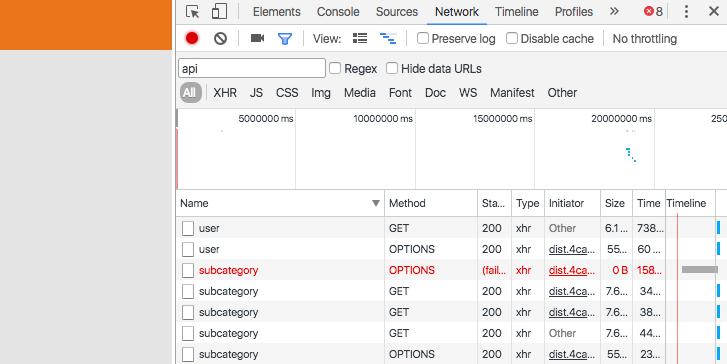
To view API traffic on a web browser, launch Chrome, then select More Tools > Developer Tools from the Settings menu. After the tools menu opens, select the Network tab. As you perform actions on the website, content will be generated in the tab beyond just API calls. If you want to isolate API calls, select the XHR filter.
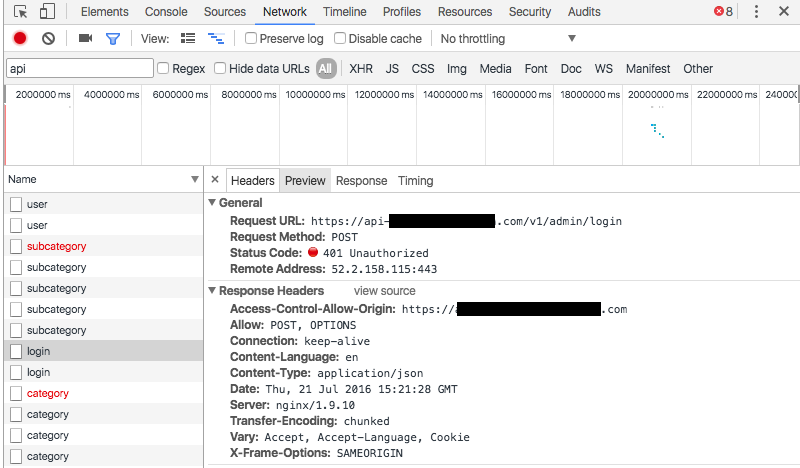
Select any item to view a summary of it. The summary displays the call's method, path, and any status codes returned by the back-end.
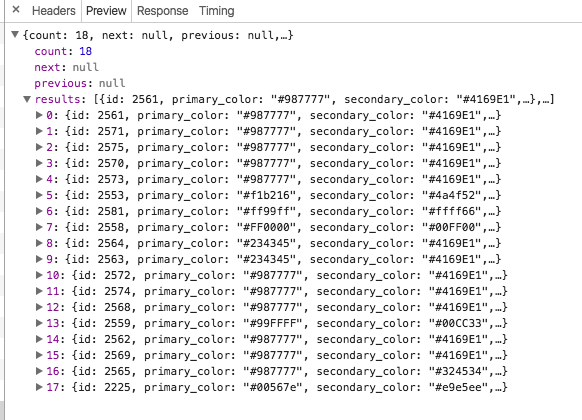
The preview tab will display the data that is sent. In the case of an API call, it will usually be in the form of a .json file.
The Response tab displays the response from the back-end.
In addition to using Chrome's built-in developer tools, other browsers also have similar tools, and Charles will also monitor desktop web traffic, in addition to mobile traffic.
Charles
Install/Setup
Charles can be found at https://www.charlesproxy.com. Download the free trial version from the website then ask a manager for the information needed to upgrade to the paid version of the software.
Immediately upon launching the app, content will be generated based on activity from desktop apps and/or web browsers.
To begin monitoring traffic on a mobile device, two pieces of information are needed:
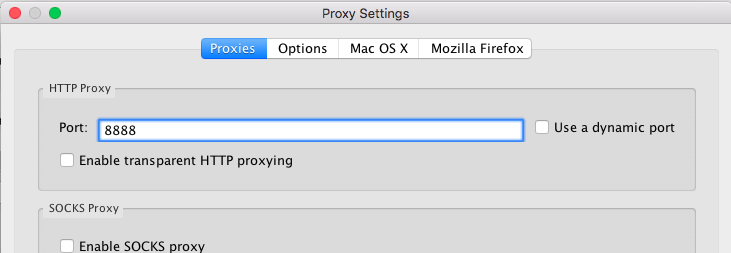
- HTTP Proxy Port: First, you need to know what port Charles will be using, so you can enter it into the mobile device. To find this port, open the Charles app and select Proxy > Proxy Settings. The port will be listed at the top of the window in the Proxies tab. By default, the port is 8888.
- IP Address. Second, you'll need the IP address of the computer that will be running the Charles app.
Once you have both pieces of information, you need to set your mobile device to send traffic to the computer running Charles.
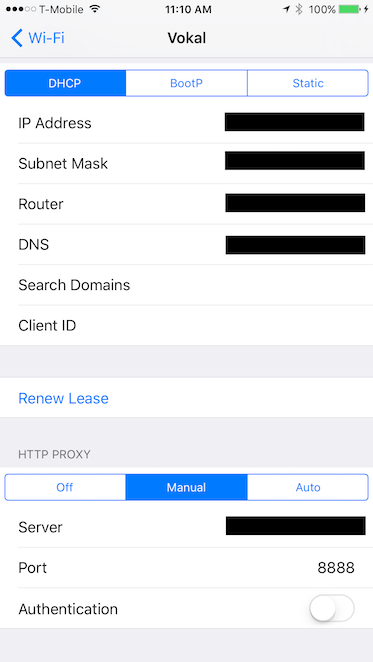
On an iOS device, launch the Settings app, select Wi-Fi, then select the i icon next to the Wi-Fi network being used. Scroll down to HTTP PROXY, then select the Manual tab. Enter the computer's IP address into the Server field, and the proxy port into the Port field.
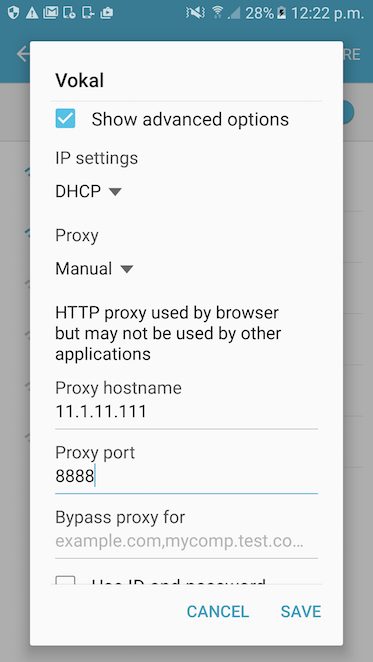
On an Android device, enter the Settings menu, select Wi-Fi, then long-press the Wi-Fi network being used to open its options menu. Select Manage Network Settings, then check the box for Show Advanced Settings to access additional settings. Set Proxy to Manual, then enter the computer's IP address into the Proxy hostname field, and the the proxy port into the Proxy Port field.
After directing the traffic to the computer, opening the Charles app, and performing actions on the mobile app, Charles may generate a prompt, asking about the connected device. Accept the prompt to begin monitoring traffic from the device.
Using Charles
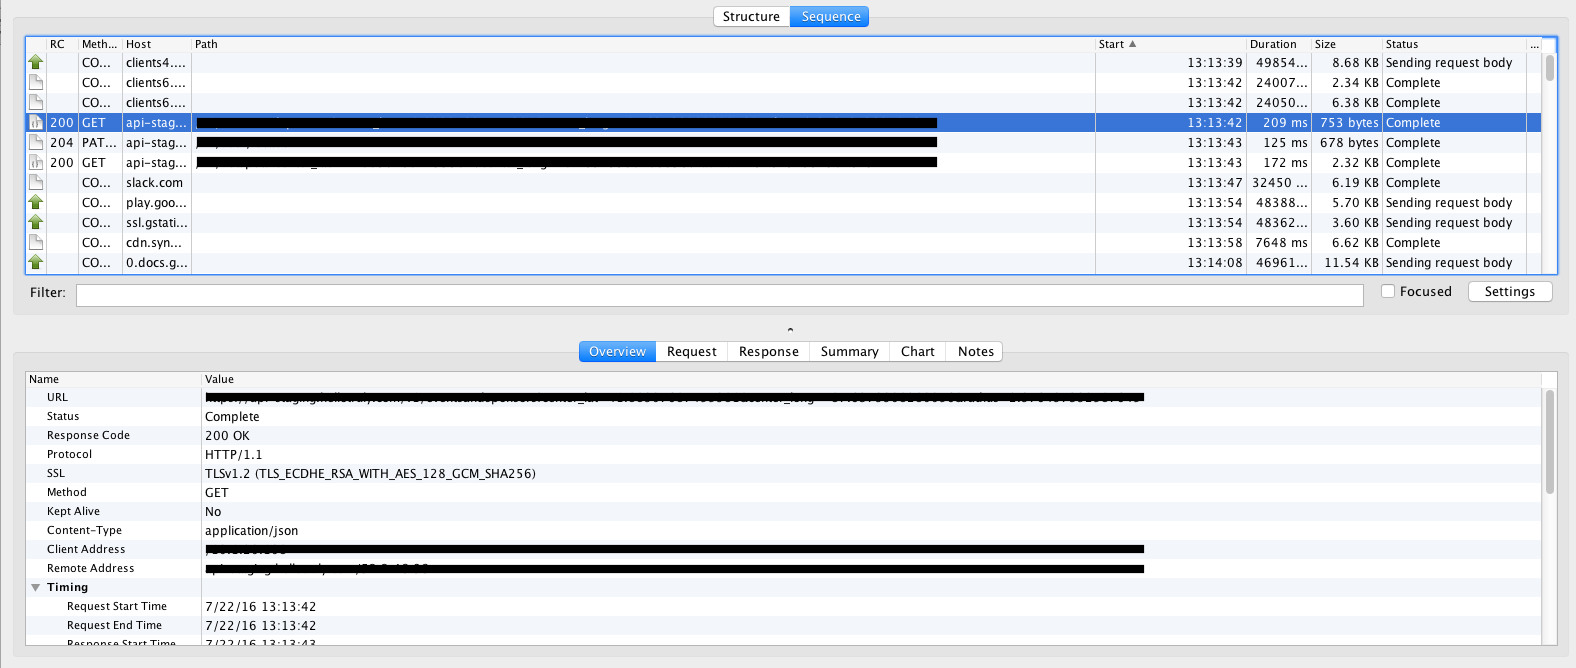
Once Charles is monitoring traffic, it works very similarly to the desktop browser's developer tools. The top of the screen lists all calls being monitored, while the bottom of the screen displays information about the selected call.
To filter out some of the extra noise (as you'll find that the mobile device and/or computer generates a number of calls from several different apps/services), enter a portion of the API path into the Filter text field.
Select any item to view a summary of it. The summary displays a combination of information that will also be provided in the Request and Response tabs, and should mainly be used to verify that you have selected the intended call.
The Request tab shows the information that has been sent from the app/website to the back-end.
The Response tab shows the information that has been returned to the app/website from the back-end. Again, depending on the method of the call, there may not be a request or a response.
Monitoring Secure Traffic
Unless development has only just begun, it is likely that the back-end will be encrypted using an SSL certificate. If that is the case, this will be stated on the Summary tab for any API calls to it, and the Request and Response tabs will display meaningless symbols in place of readable text.
To bypass the SSL certificate, steps must be taken from the Charles app, as well as the mobile device.
In the Charles App, open the Proxy > SSL Proxying Settings menu. Check the Enable SSL Proxying box, then select Add. For the host, you can enter as much as the full path of the API being used, or you can use asterisks to pull from a full domain (IE *.yourproject.com). Sometimes it may even work to just put an asterisk into the Host field and look for everything. Work with a systems engineer to determine the port, or again just place an asterisk into the field.
If you do enter asterisks for both the host and the port, most of the activity that occurs on the device and/or computer will result in a failure (red X) in Charles. Ultimately, this doesn't matter since most of the activity that fails is not what you're attempting to monitor, anyway.
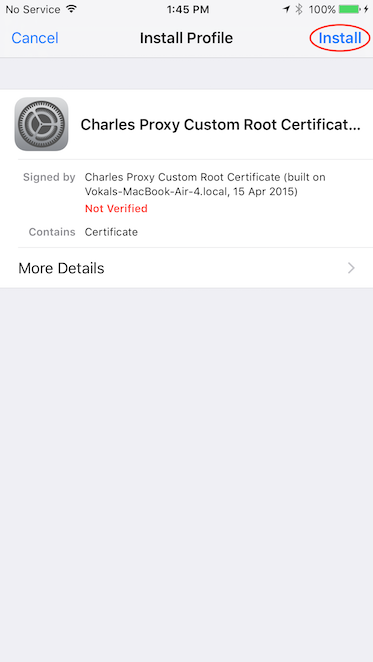
Next, you need to download the certificate to your mobile device. To download and install the certificate, setup the device to go through Charles per the instructions above, then navigate to charlesproxy.com/getssl in the device's web browser.
On an iOS device, you will immediately be asked to install the certificate as a profile. Select install on any screens encountered until the red "Not Verified" text turns green and says "Verified."
Android is slightly more complicated. Upon navigating to the URL, you will be asked to give the certificate a name. Give it any name (preferably something like "Charles"), the device will instruct you to add a pattern, pin, or password to the device's lock screen if it doesn't already have one. Set the pin to 1234 and don't forget to remove it when you have finished testing. In order to remove the pin, you will also need to delete the Charles certificate.
Some Android devices won't download the certificate. If this is the case for your device, open the Charles app on your computer, then select Help > SSL Proxying > Download Charles Root Certificate to download the certificate to your computer, allowing you to email it to the device.
Encrypted API calls should now appear in Charles.
